The GMAT is a crucial part of the business school application process. Achieving an excellent GMAT score and ranking in the top percentiles is the first stepping stone in your journey to a prestigious business career.
As the GMAT updates its format to the GMAT Focus Edition, candidates must understand the intricacies of the new scoring system and percentile rankings.
This article clearly explains the GMAT Focus Edition’s scoring system, including its total and section scores, and what these numbers mean for you.
We’ll explain how GMAT scores are calculated, offer a detailed look at the GMAT scoring charts for each section of the exam – Quantitative Reasoning, Verbal Reasoning, and Data Insights – and discuss the importance of percentile rankings. We’ll also share tips for improving your score and answer common questions about the GMAT scoring system.
By the end of this guide, you should understand how to interpret your scores and how they might impact your business school applications.
How Your GMAT Score is Calculated: GMAT Score Breakdown
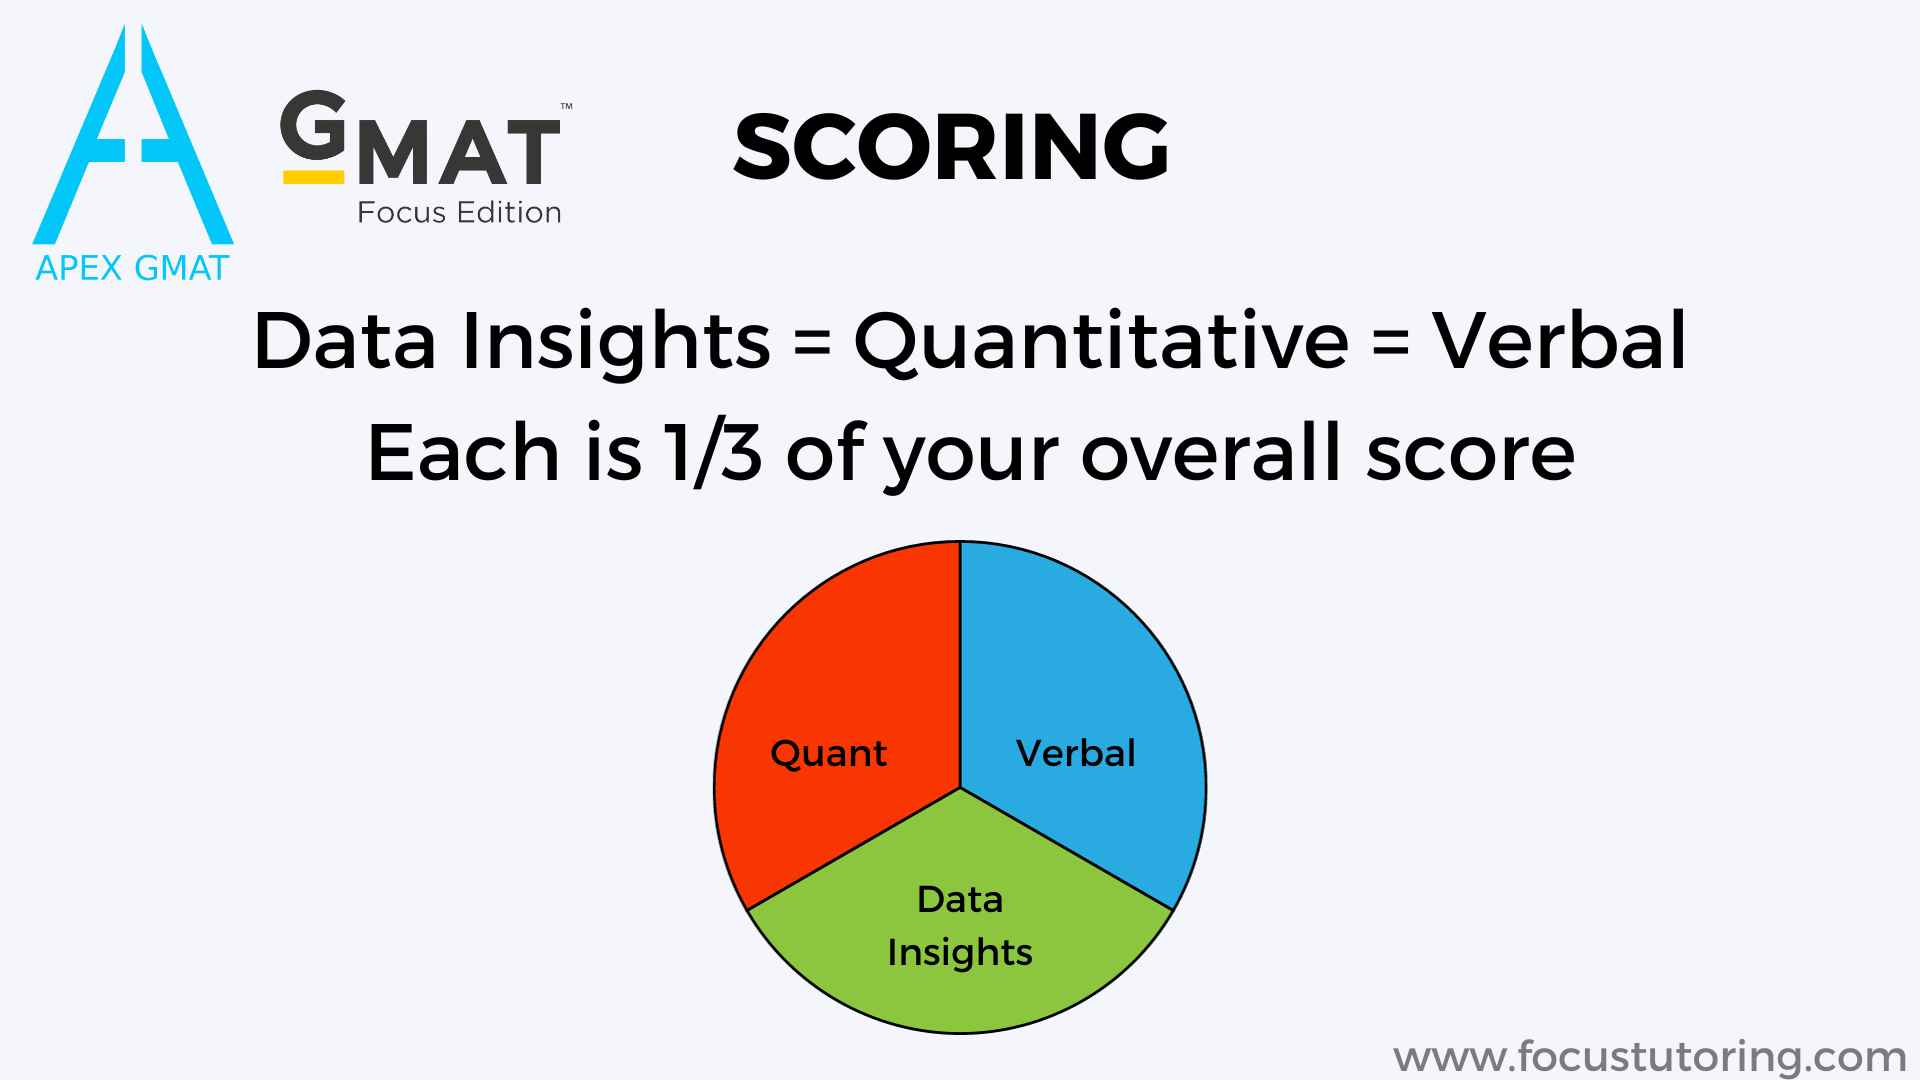
Your GMAT score combines your performance across three sections: Quantitative Reasoning, Verbal Reasoning, and Data Insights.
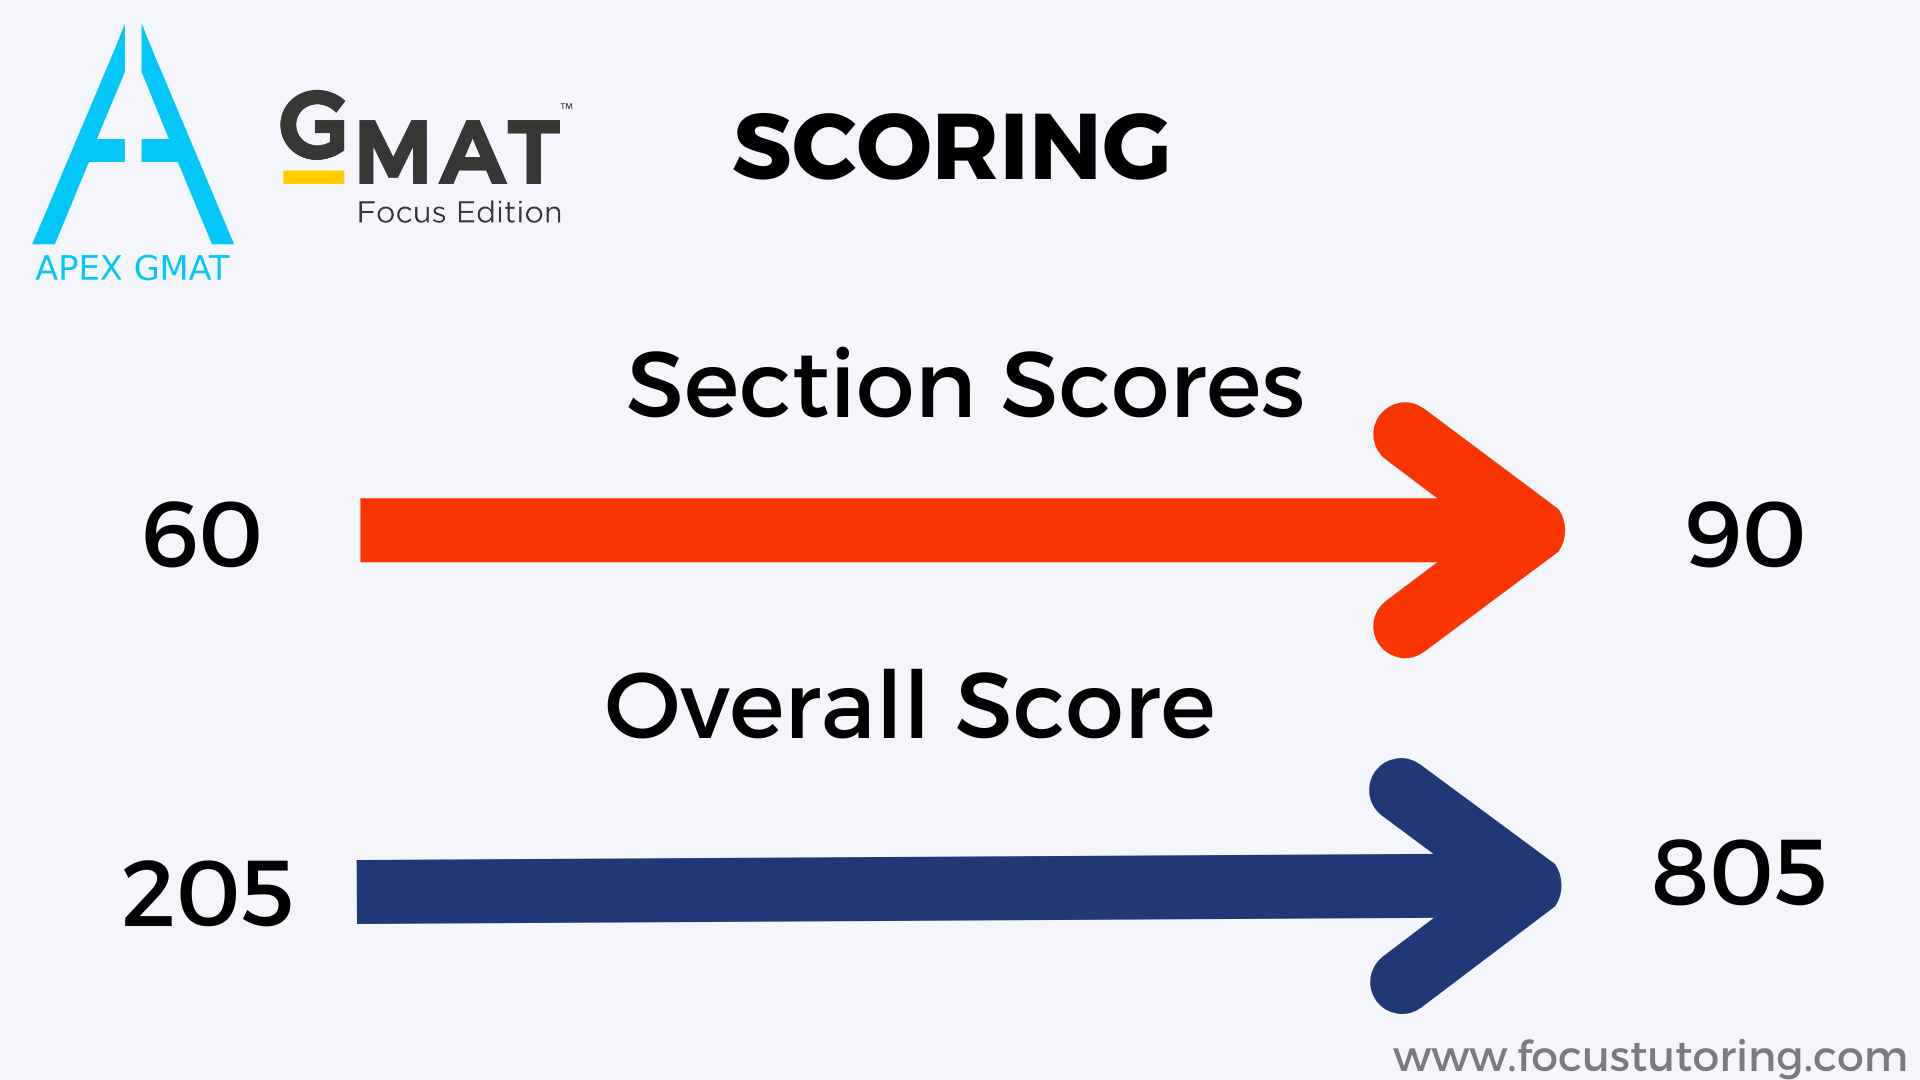
Each section has a scoring scale, ranging from 60 to 90 points. Scores are determined based upon the number of correct answers and the difficulty of the questions you’ve successfully answered.
The total score, ranging from 205 to 805, is then calculated by combining your section scores in a way that reflects your overall performance relative to other test takers. This overall performance is captured in the GMAT scoring chart below. It highlights the comprehensive evaluation of your skills.
GMAT Score Chart

Quantitative Reasoning Score Chart
The Quantitative Reasoning section of the GMAT measures your ability to analyze data and draw conclusions using quantitative problem-solving skills. The score for this section ranges from 60 to 90.
Scoring well in this section demonstrates your numerical and analytical skills, which are essential to handle the rigors of business and management studies, particularly at top ranked programs.
Understanding and practicing problem-solving can help improve your performance in this section, which is important as it’s the most likely of the sectional scores to be considered during admissions. Each incremental point increase within this range indicates an improvement in your quantitative reasoning ability, reflecting better problem-solving skills and distinguishing you from your peers.
- The revised section now includes 21 Problem-Solving questions and has been reduced to 45 minutes in length.
- Data Sufficiency questions, previously part of this section, have been moved to the Data Insights Section.
- Additionally, geometry questions have been removed from the GMAT Focus Edition.
- The use of calculators remains prohibited in this section.

Verbal Reasoning Score Chart
In the Verbal Reasoning section, you are assessed on your ability to read and understand written material, evaluate arguments, and logically infer information.
Each single-point increase is significant and indicates a better understanding of complex textual information and stronger critical reasoning skills. Moreover, the verbal section represents the most finely construed tranches in the scoring, leading to an outsized influence on your aggregate score.
Scoring highly in this section demonstrates your readiness to handle the extensive reading and analytical demands of graduate business programs.
- Sentence Correction questions have been removed from this section.
- The section now consists of 23 questions focused on Reading Comprehension and Critical Reasoning question types, roughly evenly divided between each.
This change is reflected in the updated GMAT score table, which adjusts the weight and composition of the Verbal Reasoning section.
The Reading Comprehension questions are designed to test a candidate’s ability to understand words and statements, figure out relationships between important points, draw conclusions, and follow the development of concepts. They assess reading skills such as identifying the main idea and supporting details, applying ideas, understanding the logical structure, making logical inferences and recognizing the style, tone, and purpose of a particular passage.
The Critical Reasoning questions focus on a candidate’s ability to evaluate and build arguments, as well as to judge a plan of action. The questions relate to short reading passages, usually less than 100 words. Depending on the setup, they ask the candidate to select an answer that either draws the appropriate conclusion of an argument, strengthens or weakens a given argument, explains a flaw in the argument or reasoning, or supports or challenges the argument effectively. The questions are designed to test reasoning skills without requiring specialized knowledge of the subject matter.

Data Insights Score Chart
The Data Insights section, a more recent of the GMAT, also uses a score range from 60 to 90. This section evaluates your ability to interpret data from various sources such as graphs, charts, and tables, and synthesize a lot of information in a short period of time.
A high score in this section indicates strong data interpretation skills, crucial for making informed business decisions. Improving your score involves practicing with a variety of data presentations and learning to quickly extract and manipulate key information.
- The Data Insights section consists of 20 questions, including 8 Data Sufficiency, designed to evaluate how effectively candidates can interpret and link information from various sources to make well-informed decisions.
- In this section, candidates are allowed to use an on-screen calculator, but here at Apex, we advise against this for timing and accountability reasons.
This section is adaptive, marking a change from the former GMAT’s Integrated Reasoning section. Here are the types of questions you will encounter:
Data Sufficiency: Tests your ability to analyze a quantitative or logical problem, identify necessary data, and decide if you have enough information to find a solution.
Multi-Source Reasoning: Detrminesyour skill in synthiseizing data from multiple formats, such as text, tables, and charts, to answer related questions.
Table Analysis: Focuses on your ability to sift through a table, pinpoint relevant data, and decide if it meets certain criteria.
Graphics Interpretation: Tests how well you can read and understand information displayed in graphical formats to identify patterns and draw conclusions.
Two-Part Analysis: Challenges you to solve complex problems that require both numerical calculations and verbal logic.

Our Analysis of the GMAT Focus Scoring System
One of our top-scoring GMAT tutors, Elijah Mize, analyzed the GMAT scoring system, and here’s his very useful explanation:
On each section, every point above 60 (the base) translates to about 6 ⅔ points on your aggregate score. For example, if you score:
80 on the Quantitative, 85 on the Verbal, and 81 on the Data Insights, you have 66 excess points.
80-60 = 20 points from the Quant
85-60 = 25 points from the Quant
83-60 = 23 points from the Quant
20+25+21 = 66 excess points.
You get 205 for writing your name + (66 * 6 ⅔ = 440) from each section for a total of 205+440 = 645
Another way to think about it: Every excess point delivers ⅔ of 10 points on the main score. For example, if you score 82 on each of the three sections, you collected 22 points on each of them (the difference between 82 and the starting value of 60) for a total of 66 section points. If we multiply this 66 by 2/3, we obtain the number of total score points you earned. 66 * 2/3 = 44, so you earned 44 total score points. Thus, we would add 440 to the starting value of 205, calculating a total score of 645.
We can capture this process in the following formula, where Quantitative, Verbal, and Data Insights are the section scores:
Total score = (Quantitative + Verbal + Data Insights – 180)(20/3) + 205
My section scores and total scores on both official practice exams conformed to this formula. (Note that in some cases, it will be necessary to round the resulting total score to the nearest integer ending with a 5.)
What are Percentile Rankings?
Percentile rankings compare your GMAT scores with those of other test takers. For example, if you are in the 70th percentile, you scored better than 70% of test takers while 29% performed more strongly than you. (70 + you + 29 = 100 percent)
These rankings give context to your score, showing how your performance stacks up against your peers. Percentile rankings adjust slightly each year based on the overall performance of all the test takers.
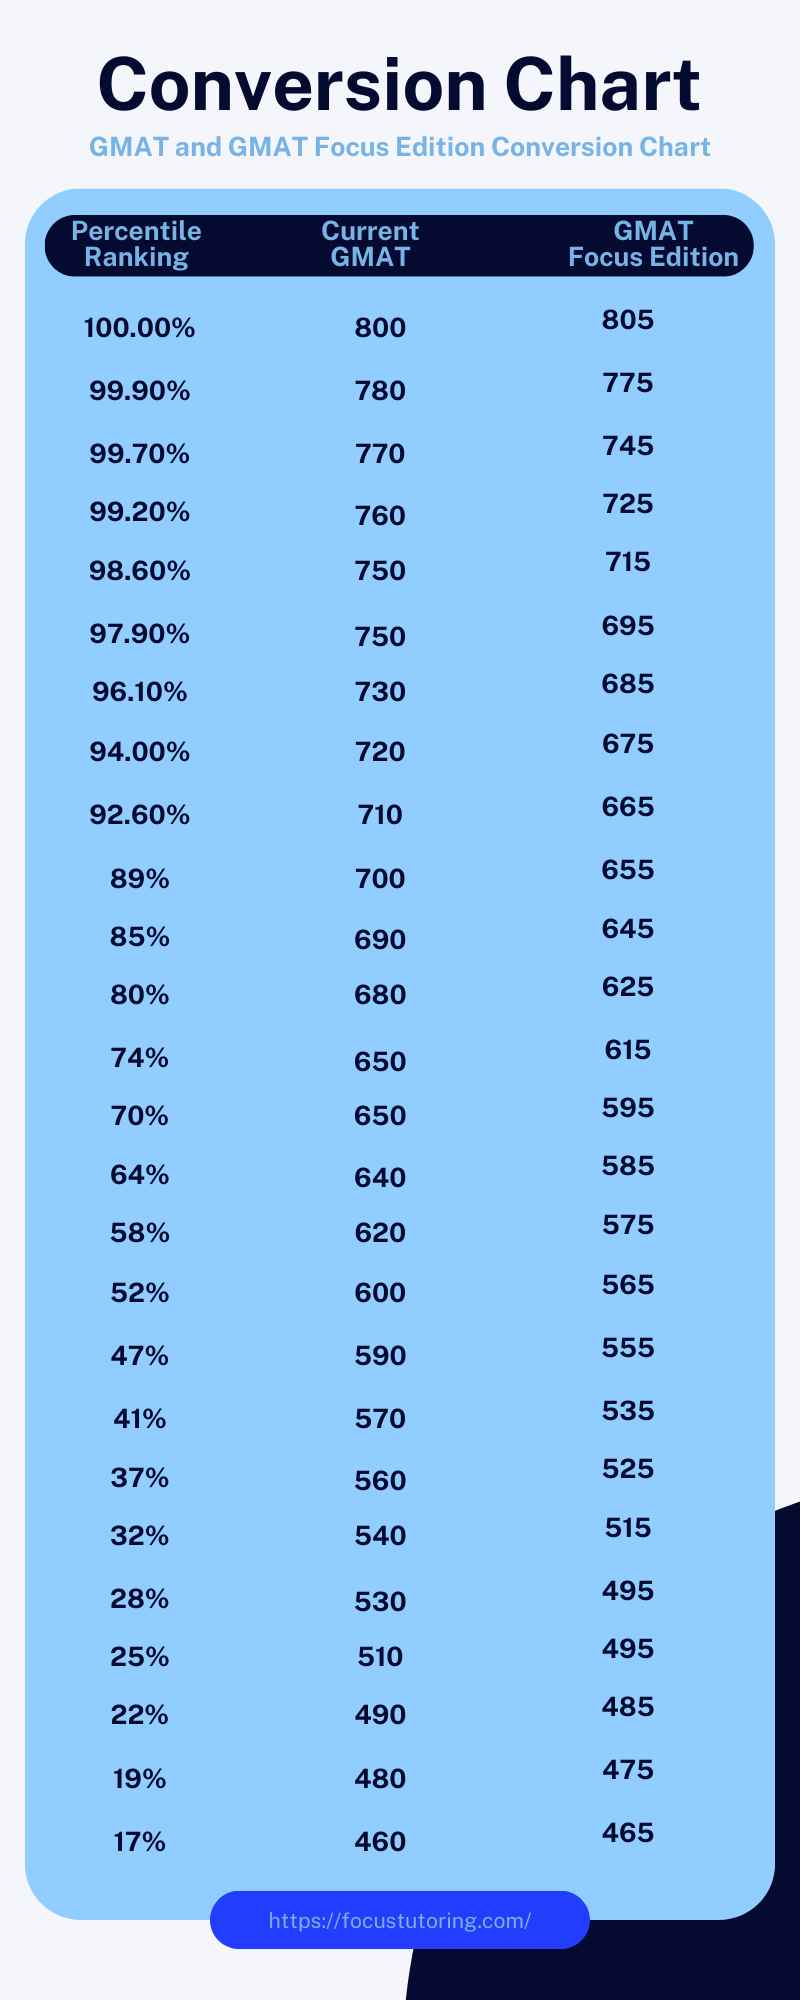
GMAT to GMAT Focus Edition Score and Percentile Conversion Chart
GMAC has stressed that new GMAT scores do not directly correspond to neighboring scores on the old GMAT. For example, a 655 on the new GMAT represents a higher percentile than a 650 on the older GMAT.
According to GMAC’s projections, based upon the last five years of test data, a 705 on the new GMAT will be the beginning of the 99th percentile, roughly equivalent to a 760 on the older GMAT! Time will tell whether this projection is accurate.
If you have any questions about the GMAT Focus Edition or want to inquire about Apex’s test preparation services, please don’t hesitate to book a 30-minute complimentary call.
Contributor: Cynthia Addoumieh and Elijah Mize (Apex Instructor)